Exercises
Exercise 11-27
Goal | Female | Male | FemaleProp | MaleProp |
HSC-HM | 14 | 31 | 0.21 | 0.46 |
HSC-LM | 7 | 18 | 0.10 | 0.27 |
LSC-HM | 21 | 5 | 0.31 | 0.07 |
LSC_LM | 25 | 13 | 0.37 | 0.19 |
Total | 67 | 67 | 1.00 | 1.00 |
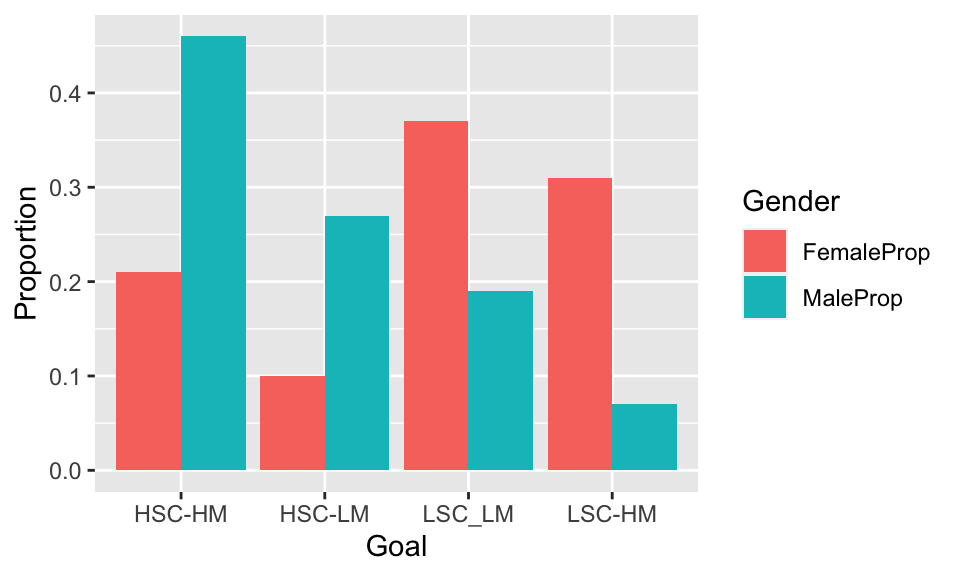
- There is a remarkable difference in the two distributions. Most of the Male students sports fall in a HSC categories, while most of the female students fall in the LSC categories.
Exercise 11-29 and 11-31
- H0: the distribution over the four groups is the same for
male and female students at the university of interest
HA: the distribution over the four groups is not the same for male and female students at the university of interest
Test to use: \(\chi^2\)-test
Conditions check:
- independent random samples: √, see text - 10% condition; a large
university will have more than 670 female and moren than 670 male
students
- LC condition, see part (b)
- Expected Values
Female | Male |
22.5 | 22.5 |
12.5 | 12.5 |
13.0 | 13.0 |
19.0 | 19.0 |
- \(\chi^2\)
Contributions
Female | Male |
3.21 | 3.21 |
2.42 | 2.42 |
4.92 | 4.92 |
1.89 | 1.89 |
\(\chi^2\)-value of the test = 24.9
with df = 3.
P-value = 1.622e-05 < .001
P-value < \(\alpha\), so reject
H0.
Context: support found for the hypothesis that the distributions among
the four categories differ for male and female students at this
university.
Exercise 11-37
Group | Treatment | Subjects | Successes | ProportionSuccesses |
1 | NicotinePatch | 244 | 40 | 0.164 |
2 | Drug | 244 | 74 | 0.303 |
3 | Patch plus Drug | 245 | 87 | 0.355 |
4 | Placebo | 160 | 25 | 0.156 |
Total | 893 | 226 | 0.253 |
The null-hypothesis states that all the treatments have the same success rate, even the placebo, for smokers like these in the experiment
We use a \(\chi^2\) test for this.
H0: the success rate is the same for all four
treatments
HA: the success rate is not the same for all four
treatments
We use a \(\chi^2\)-test.
Conditions check:
- independent random samples? yes because it is a randomized
experiment
- 10% condition; not applicable, because it’s a randomized
experiment
- LC condition: all expected values at least 5” yes, see below
Observed Values
Successes | Failures | Sum |
40 | 204 | 244 |
74 | 170 | 244 |
87 | 158 | 245 |
25 | 135 | 160 |
226 | 667 | 893 |
Expected Values
Successes | Failures |
61.751 | 182.249 |
61.751 | 182.249 |
62.004 | 182.996 |
40.493 | 119.507 |
\(\chi^2\) Contributions
Successes | Failures |
7.66 | 2.60 |
2.43 | 0.82 |
10.08 | 3.41 |
5.93 | 2.01 |
\(\chi^2\)-value of the test = 34.94
with df = 3.
P-value = 1.256e-07 < .001
P-value < \(\alpha\), so reject
H0.
Context: convincing evidence that at least one of the success
proportions for the different treatments, differs significantly from the
others.
Exercise 11-39
Follow-up analysis Exercise 11-37
Top 3 ranking of highest contribution to \(\chi^2\)-value:
(1) Successes for treatment 3.Patch plus Drug
(2) Successes for treatment 1.Nicotine Patch
(3) Failures for treatment 3.Patch plus Drug
Treatment 3.Patch plus Drug has the highest positive success rate and
lowest failure rate and contributes the most to the \(\chi^2\) test statistic value.
Treatment 1.NicotinePatch has lower success rate than expected, actually
comparable with Treatment 4.Placebo.